1.Main points
- The Consumer Prices Index including owner occupiers’ housing costs (CPIH) rose by 6.3% in the 12 months to September 2023, the same rate as in August.
- On a monthly basis, CPIH rose by 0.5% in September 2023, compared with a rise of 0.4% in September 2022.
- The Consumer Prices Index (CPI) rose by 6.7% in the 12 months to September 2023, the same rate as in August.
- On a monthly basis, CPI rose by 0.5% in September 2023, the same rate as in September 2022.
- The largest downward contributions to the monthly change in both CPIH and CPI annual rates came from food and non-alcoholic beverages, where prices fell on the month for the first time since September 2021, and furniture and household goods, where prices rose by less than a year ago.
- Rising prices for motor fuel made the largest upward contribution to the change in the annual rates.
- Core CPIH (excluding energy, food, alcohol and tobacco) rose by 5.9% in the 12 months to September 2023, the same rate as in August; the CPIH goods annual rate fell slightly from 6.3% to 6.2%, while the CPIH services annual rate rose from 6.1% to 6.3%.
- Core CPI (excluding energy, food, alcohol and tobacco) rose by 6.1% in the 12 months to September 2023, down from 6.2% in August; the CPI goods annual rate fell slightly from 6.3% to 6.2%, while the CPI services annual rate rose from 6.8% to 6.9%.
2.Consumer price inflation rates
Table 1: CPIH, OOH component and CPI index values, and annual and monthly rates, UK
September 2022 to September 2023
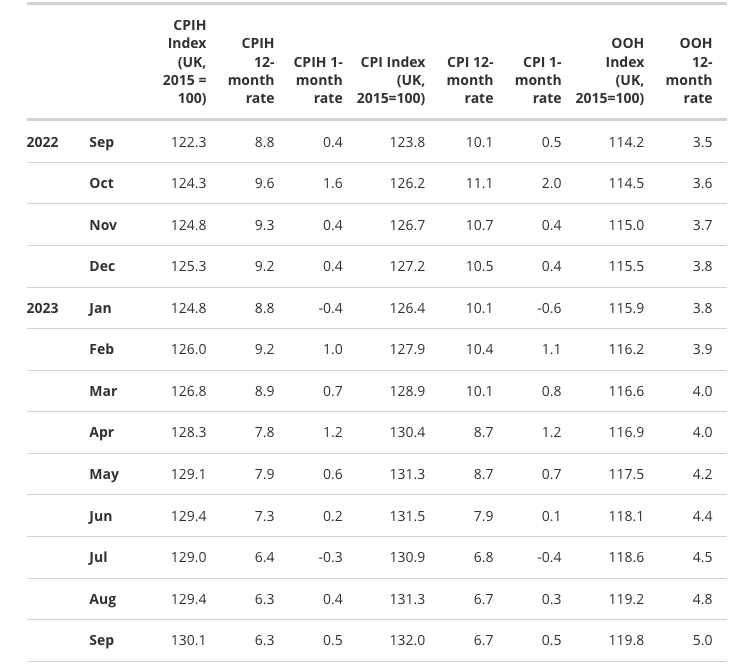
Source: Consumer price inflation from the Office for National Statistics
Figure 1: Annual CPIH and CPI inflation rates increased at the same rate as in August 2023
CPIH, OOH component and CPI annual inflation rates for the last 10 years, UK, September 2013 to September 2023
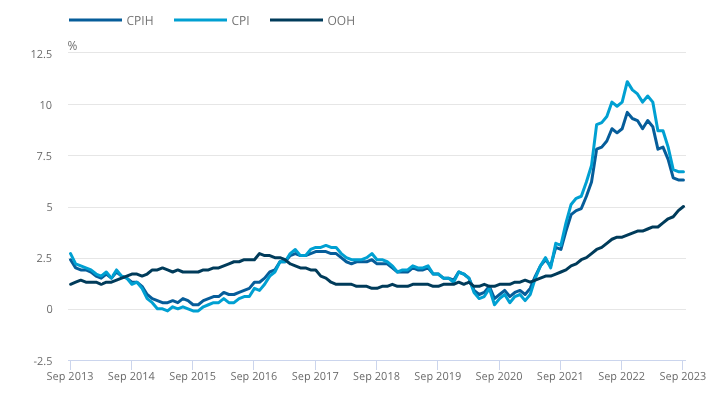
Source: Consumer price inflation from the Office for National Statistics
The Consumer Prices Index including owner occupiers’ housing costs (CPIH) rose by 6.3% in the 12 months to September 2023, the same rate as in August, but down from a recent peak of 9.6% in October 2022. Our indicative modelled consumer price inflation estimates suggest that the October 2022 rate was the highest in over 40 years (the CPIH National Statistic series begins in January 2006). Excluding August 2023, the rate in September 2023 was the lowest since March 2022.
The identical annual rate between August and September 2023 was a result of prices rising by 0.5% on the month compared with a rise of 0.4% a year earlier.
The owner occupiers’ housing costs (OOH) component of CPIH rose by 5.0% in the 12 months to September 2023, up from 4.8% in August. This is the highest annual rate since March 1993 where it was also 5.0%. The OOH rose by 0.5% on the month in September 2023, compared with 0.3% the same month a year ago.
The Consumer Prices Index (CPI) rose by 6.7% in the 12 months to September 2023, the same rate as in August, and down from a recent peak of 11.1% in October 2022. Our indicative modelled consumer price inflation estimates suggest that the October 2022 peak was the highest annual inflation rate since 1981 (the CPI National Statistic series begins in January 1997). Excluding August 2023, the rate in September 2023 was the lowest since February 2022.
The identical rate in August and September 2023 was a result of prices rising by 0.5% on the month, the same rate as a year earlier.
The main drivers of the annual inflation rate for CPIH and CPI are the same where they are common to both measures. However, the owner occupiers’ housing costs (OOH) component accounts for 16% of the CPIH and is the main driver for differences between the CPIH and CPI inflation rates. This makes CPIH our most comprehensive measure of inflation.
We cover this in more detail in Section 4: Latest movements in CPIH inflation of this bulletin, and provide a commentary on the CPI in Section 5: Latest movements in CPI inflation. We also cover both CPIH and CPI in Section 3: Notable movements in prices, though the figures reflect CPIH.
3.Notable movements in prices
The identical annual inflation rates in August and September 2023 principally reflected offsetting contributions across four divisions. Large downward effects from food and non-alcoholic beverages and furniture and household goods were largely offset by upward contributions from transport, and restaurants and hotels.
Table 2: CPIH annual and monthly inflation rates by division, UK
September 2023, August 2023, and September 2023
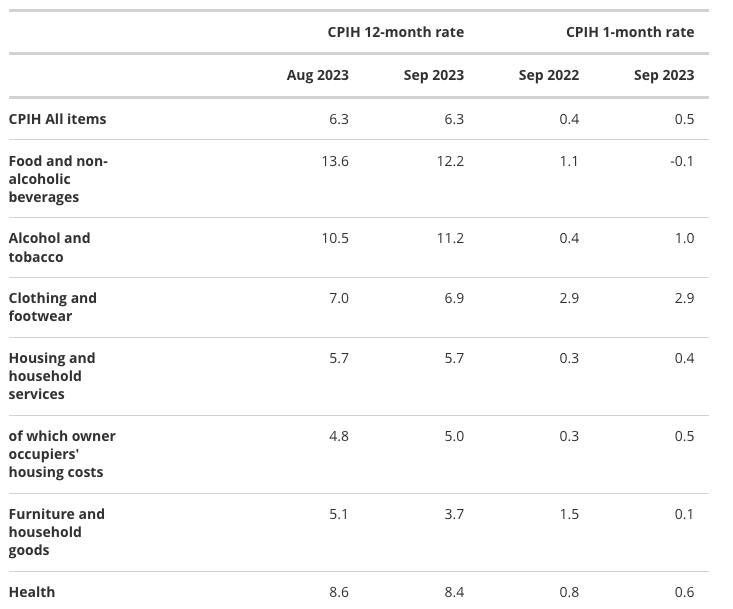
Source: Consumer price inflation from the Office for National Statistics
Food and non-alcoholic beverages
Food and non-alcoholic beverage prices fell by 0.1% between August and September 2023, compared with a rise of 1.1% between the same two months a year ago. This resulted in an easing in the annual rate to 12.2% in September 2023, down from 13.6% in August and a recent high of 19.2% in March 2023, which was the highest annual rate seen for over 45 years.
Figure 2: Annual inflation rate for food and non-alcoholic beverages eases for the sixth consecutive month
CPIH, and food and non-alcoholic beverages annual inflation rates, UK, September 2013 to September 2023
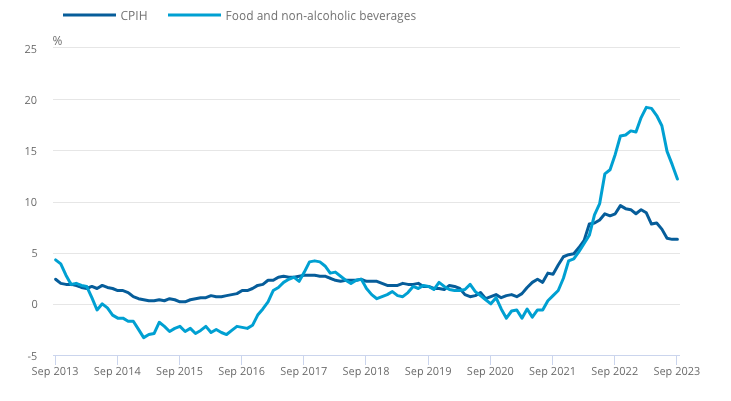
Source: Consumer price inflation from the Office for National Statistics
The easing in the annual rate for food and non-alcoholic beverages between August and September 2023 was driven by relatively small price movements in 8 of the 11 detailed classes. The largest downward contributions came from the milk, cheese and eggs, and mineral waters, soft drinks and juices categories.
Within milk, cheese and eggs, there were downward effects from all subclasses, but the largest downward effect came from cheese and curd, with prices for these products falling by 3.3% between August and September this year. This is compared with a rise of 0.3% between the same two months a year ago. This has led to the annual rate for milk, cheese and eggs easing to 12.3% in the year to September 2023, down from 15.3% in August.
Within mineral waters, soft drinks and juices there were downward effects from all subclasses, but the largest downward effect came from fruit and vegetable juices and from soft drinks. This has led to the annual rate for mineral waters, soft drinks and juices easing to 10.7% in the year to September 2023, down from 14.7% in August.
The only class to provide an upward contribution was fish, where the largest upward effect came from frozen prawns. This led to the annual rate for fish increasing to 8.7%, up from 6.8% in August.
Furniture and household goods
Prices of furniture and household goods rose by 0.1% between August and September this year, compared with a 1.5% rise a year ago. This resulted in an annual rate of 3.7% in September 2023, down from 5.1% in August, and the lowest rate recorded since July 2021.
The easing in the annual rate was driven by negative contributions from five of the six groups in this division, with the largest downward contribution coming from the major household appliances and small electrical goods category. Within this category, all subclasses were either flat or provided a downward effect, and the items that provided the largest negative contributions were washing machines, heaters and air conditioners, vacuum cleaners, and electric cooling fans.
Transport
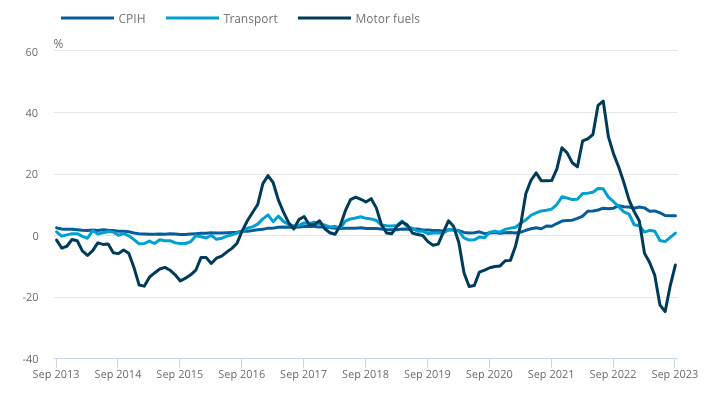
The negative contributions from food and non-alcoholic beverages and furniture and household goods were offset partially by an upward effect from transport, where prices fell by 0.2% between August and September 2023. This is compared with a fall of 1.7% between the same two months last year. On an annual basis, prices rose by 0.7% in the year to September, compared with a fall of 0.7% in the year to August.
The overall upward effect from transport was almost entirely because of movements in the price of motor fuels. The average price of petrol rose by 5.1 pence per litre between August and September 2023 to stand at 153.6 pence per litre in September 2023. Last year, prices fell by 8.7 pence per litre to stand at 166.5 pence per litre in September 2022. Similarly, diesel prices rose by 6.3 pence per litre this year to stand at 157.4 pence per litre. Last year, they fell by 5 pence per litre to stand at 181.6 pence per litre in September 2022.
These movements resulted in motor fuel prices falling by 9.7% in the year to September 2023, compared with a fall of 16.4% in the year to August.
Within transport, the effect from motor fuels was offset partially by downward effects from the purchase of vehicles and from air fares. Vehicle prices were flat on the month compared with a 0.5% rise a year ago. On an annual basis, prices rose by 0.9% in the year to September, compared with a rise of 1.4% in the year to August.
Air fares fell by 23.2% between August and September 2023, compared with a fall of 25.1% a year ago. However, because the weight for this subclass increased significantly between 2022 and 2023, this amplified the impact of the September 2023 monthly movement on the headline, resulting in a negative contribution to the change in the Consumer Prices Index including owner occupiers’ housing costs (CPIH) 12-month rate. On an annual basis, prices rose by 14.9% in the year to September, compared with a rise of 12.0% in the year to August.
Figure 3: Annual inflation rate for motor fuels less negative in September 2023
CPIH, transport and motor fuels annual inflation rates, UK, September 2013 to September 2023
Restaurants and hotels
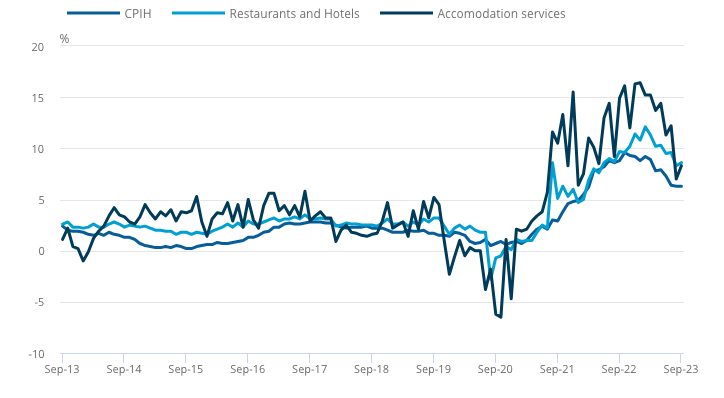
The annual inflation rate for restaurants and hotels was 8.6% in September 2023, up from 8.3% in August. On a monthly basis, prices rose by 0.9% between August and September 2023, compared with a rise of 0.6% between the same two months a year ago.
As the contribution from catering was flat, the increase in the rate was a reflection of the upward effect from accommodation services, where prices rose by 3.4% between August and September 2023. This is compared with a rise of 2.2% between the same two months last year.
The upward effect came from overnight hotel accommodation, where prices are taken just before the date of stay and can vary depending on the number of available rooms, resulting in month-to-month volatility. However, there was a small counteracting downward effect from the “accommodation services proxy”, which includes self-catering and some non-self-catering holiday accommodation, where the stay tends to be longer than in the overnight hotel accommodation category.
Figure 4: Annual inflation rate for restaurants and hotels division remains elevated
CPIH, restaurants and hotels, and accommodation services annual inflation rates, UK, September 2013 to September 2023
4.Latest movements in CPIH inflation
Figure 5: CPIH goods inflation rate eases in September 2023 while services inflation rises slightly
CPIH goods, services and core annual inflation rates for the last 10 years, UK, September 2013 to September 2023
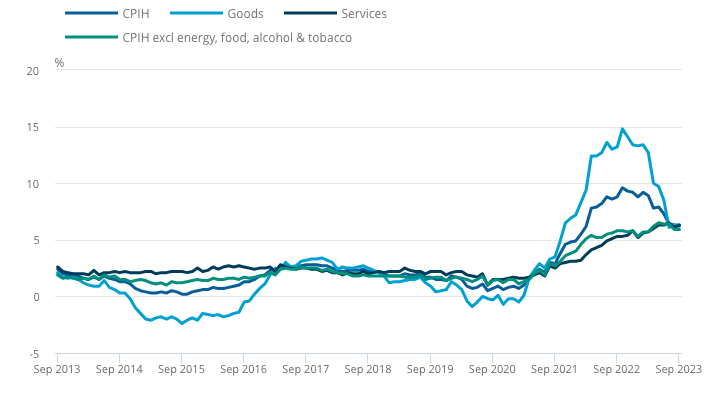
Figure 5 shows the annual inflation rates for the Consumer Prices Index including owner occupiers’ housing costs (CPIH) all goods and all services series, together with CPIH excluding energy, food, alcohol and tobacco (often referred to as core CPIH). The CPIH inflation rate is added for comparison.
The core CPIH annual inflation rate was 5.9% in September 2023. This is the same rate as in August and is down from 6.5% in May, which was the highest rate since November 1991, when it was also 6.5% in the constructed historical series.
The CPIH all goods index rose by 6.2% in the 12 months to August 2023, down from 6.3% in August. The category providing the largest negative contribution to the fall in the rate is non-energy industrial goods, where prices rose by 4.9% in the year to September 2023, having risen by 5.3% in the year to August. There was a larger offsetting positive contribution from energy where prices fell by 0.7% in the year to September 2023, having fallen by 3.6% in the year to August. However, once all the categories have been taken into account, there was a fall in the all goods index.
The CPIH all services index rose by 6.3% in the 12 months to September 2023, up from 6.1% in August. The largest upward contributions to the change came from recreation and personal services.
Figure 6: Offsetting contributions lead to the same rate of CPIH in September 2023 as in August 2023
Contributions to change in the annual CPIH inflation rate, UK, between August and September 2023
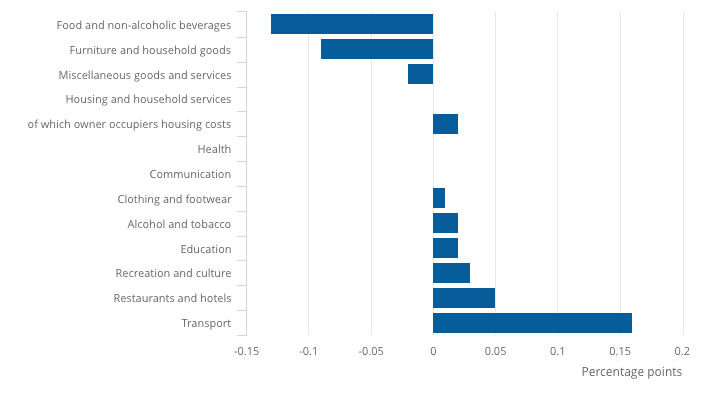
Figure 6 shows how each of the main groups of goods and services contributed to the change in the annual CPIH inflation rate between August and September 2023. To understand what has changed the inflation rate between these months, we can look at the differences between the contributions each of the 12 divisions made to the rate in August 2023 and the rate in September 2023. These differences sum to the change in the annual CPIH rate between the latest two months, which is zero because the rate remained the same at 6.3%.
The equivalence in rates in September 2023 and August 2023 comes from downward contributions from three divisions, offset by upward contributions from six divisions. The largest downward contributions came from food and non-alcoholic beverages and from furniture and household goods. The largest upward contributions came from transport and from restaurants and hotels.
Figure 7: Housing and household services continues to make the largest contribution to the annual CPIH rate
Contributions to the annual CPIH inflation rate, UK, September 2021 to September 2023
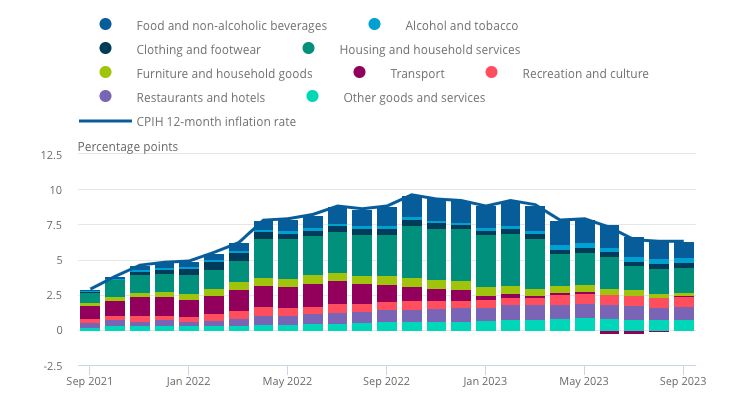
Figure 7 shows the extent to which the distinct categories of goods and services have contributed to the overall annual CPIH inflation rate over the last two years.
The contribution of each category to the annual rate depends on both the price movement in that category as well as its weight. Contributions help to explain what is driving the inflation rate by expressing it as the additive sum of its parts. For any one month, when added together, the contributions from the 12 divisions sum to the overall CPIH inflation rate. For example, the rate is 6.3% in September 2023.
The largest upward contributions to the annual CPIH inflation rate in September 2023 came from housing and household services, and food and non-alcoholic beverages. The contribution from the former group was 1.77 percentage points, the same as in August, and down from a recent high of 3.70 percentage points in January this year. The contribution from the latter group eased for a sixth successive month, from a high of 1.76 percentage points in March to 1.15 percentage points in September.
The 0.39 percentage point contribution to the annual rate in September 2023 from alcohol and tobacco was the largest from that division since at least the start of the National Statistics series in 2006. The 0.23 percentage point contribution to the annual rate in September 2023 from furniture and household goods was the smallest from that division since September 2021. The 0.08 percentage point contribution to the annual rate from transport was positive for the first time since May 2023.
Figure 8: Contribution from owner occupiers’ housing costs continued to rise between August and September 2023
Contributions of housing components to the annual CPIH inflation rate, UK, January 2015 to September 2023
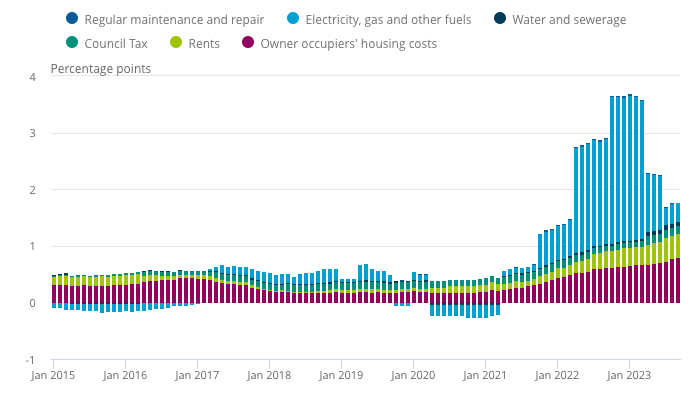
Figure 8 shows the contribution of owner occupiers’ housing (OOH) costs and Council Tax to the annual CPIH inflation rate in the context of wider housing-related costs. The Consumer Prices Index (CPI) differs from the CPIH in that it does not include these two components.
OOH’s contribution rose from 0.78 to 0.80 percentage points between August and September 2023, meaning the contribution is now higher than at any time since at least January 2006. The contribution from rents rose from 0.41 to 0.42 percentage points between August and September 2023, which is also higher than at any time since at least January 2006.
5.Latest movements in CPI inflation
While the Consumer Prices Index including owner occupiers’ housing costs (CPIH) is our lead and most comprehensive measure of consumer price inflation, the Consumer Prices Index (CPI) is based on a harmonised methodology developed by Eurostat and allows for international comparisons to be drawn. For more information on the use cases for our consumer price inflation statistics, please refer to our Measuring changing prices and costs for consumers and households, proposed updates: March 2020 article.
Figure 9 shows CPI inflation against the EU and Group of Seven (G7) countries that produce a comparable measure. Further information on international comparisons can be found in our Food and energy price inflation, UK: 2023 article, released on 23 May 2023.
Figure 9: UK inflation remains above that of France and Germany
CPI compared with selected G7 and EU annual inflation rates, September 2013 to September 2023
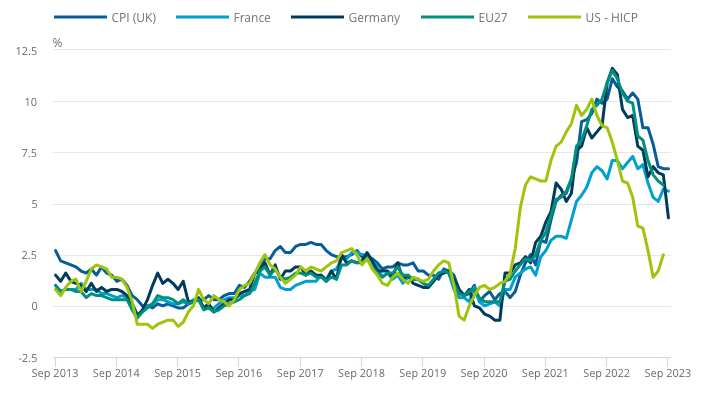
Table 3: CPI annual and monthly inflation rates by division, UK
September 2022, August 2023, and September 2023
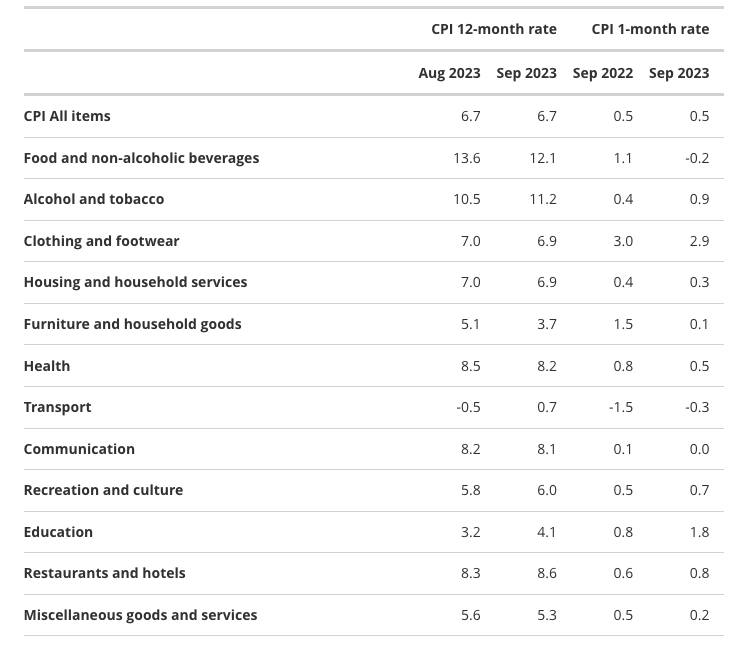
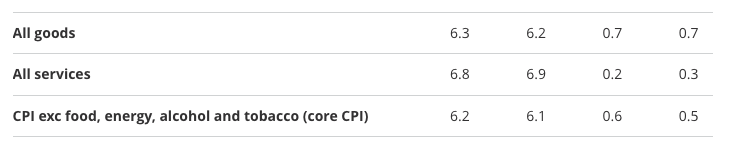
Figure 10: CPI goods inflation rate eases in September 2023 while services inflation rises slightly
CPI goods, services and core annual inflation rates for the last 10 years, UK, September 2013 to September 2023
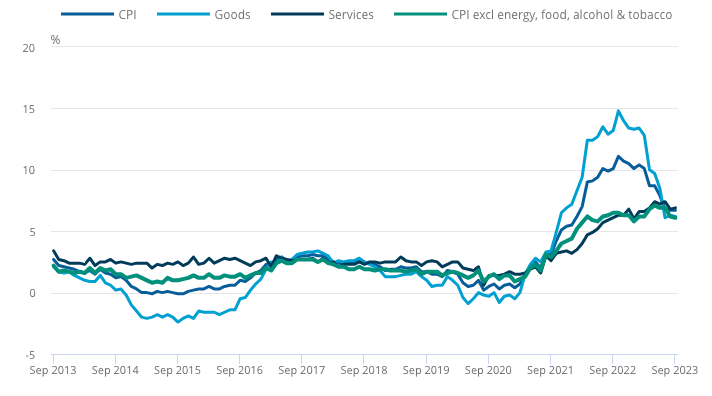
Figure 10 shows the annual inflation rates for the CPI all goods and all services series, together with CPI excluding energy, food, alcohol and tobacco (often referred to as core CPI).
Annual core CPI rose by 6.1% in the year to September 2023, down from 6.2% in August and down from a recent high of 7.1% in May, which was the highest recorded since March 1992. The CPI all goods index rose by 6.2% in the year to September 2023, down from 6.3% in August. The CPI all services index rose by 6.9% in the year to September 2023, up from 6.8% in August 2023 and down from 7.4% in July 2023, which was the joint highest rate (with May 2023) since March 1992.
As with the all-items annual inflation rates, the drivers of CPIH and CPI goods and services inflation are the same (with the exception of owner occupiers’ housing costs and Council Tax, which are excluded from CPI). The drivers are discussed in more detail in Section 4: Latest movements in CPIH inflation.
Figure 11: Annual CPI inflation remains at the same rate despite a large upward contribution from motor fuels in the transport division
Contributions to change in the annual CPI inflation rate, UK, between August and September 2023
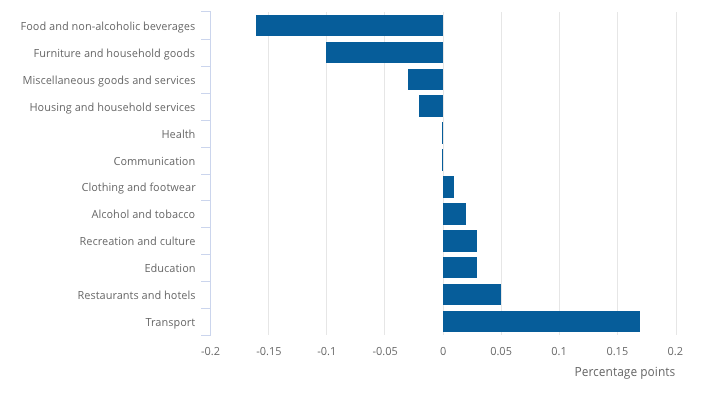
Figure 11 shows how each of the main groups of goods and services contributed to the change in the annual CPI inflation rate between August and September 2023.
The equivalence in rates in September 2023 and August 2023 comes from downward contributions from four divisions, offset by upward contributions from six divisions. The largest downward contributions came from food and non-alcoholic beverages and from furniture and household goods. The largest upward contributions came from transport and from restaurants and hotels.
Although the sizes of the contributions differ from CPIH, the main drivers to the change are the same where they are common to both measures.
Figure 12: Largest contribution to annual CPI inflation rate comes from food and non-alcoholic beverages
Contributions to the annual CPI inflation rate, UK, September 2021 to September 2023
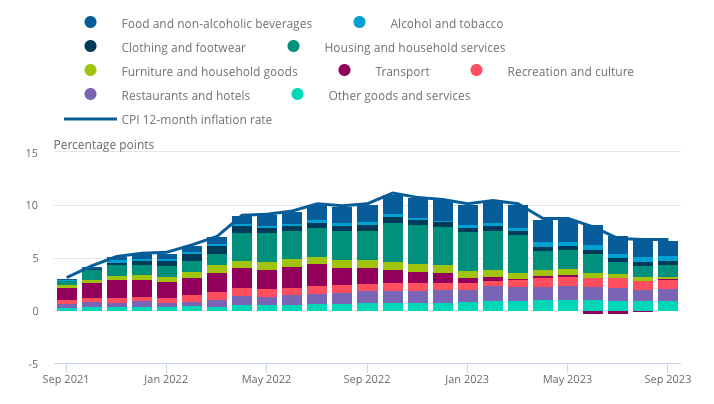
Figure 12 shows the extent to which the distinct categories of goods and services have contributed to the overall annual CPI inflation rate over the last two years.
The CPIH includes extra housing components not included in the CPI. The different items included in each index mean that the largest contributions to the annual CPI inflation rate were not from the same divisions that made the largest contributions to the annual CPIH rate. The largest contribution came from food and non-alcoholic beverages (at 1.42 percentage points) and the second largest contribution came from restaurants and hotels (at 1.14 percentage points).
6.Consumer price inflation data
Consumer price inflation tables
Dataset | Released 18 October 2023
Measures of monthly UK inflation data including the Consumer Prices Index including owner occupiers’ housing costs (CPIH), Consumer Prices Index (CPI) and Retail Prices Index (RPI). These tables complement the consumer price inflation time series dataset.
Consumer price inflation time series
Dataset MM23 | Released 18 October 2023
Comprehensive database of time series covering measures of inflation data for the UK including the CPIH, CPI and RPI.
Consumer price inflation detailed briefing note
Dataset | Released 18 October 2023
The consumer price inflation detailed briefing note contains details of the items contributing to the changes in the CPIH, details of any notable movements, a summary of the reconciliation of CPIH and RPI, and the outlook, which looks ahead to next month’s release.
Please note that we have removed the sections containing detailed RPI data from the briefing note. These are the 14 worksheets from Food through to Leisure Services.
7.Glossary
Annual inflation rate
The most common approach to measuring inflation is the 12-month or annual inflation rate, which compares prices for the latest month with the same month a year ago. In any given month, the annual rate is determined by the balance between upward and downward price movements of the range of goods and services included in the index.
Consumer price inflation
Consumer price inflation is the rate at which the prices of goods and services bought by households rise or fall. It is estimated by using price indices. For an overview of the indices and their uses, please see our Consumer price indices, a brief guide: 2017 article.
Consumer Prices Index including owner occupiers’ housing costs
The Consumer Prices Index including owner occupiers’ housing costs (CPIH) is the most comprehensive measure of inflation. It extends the Consumer Prices Index (CPI) to include a measure of the costs associated with owning, maintaining and living in one’s own home, known as owner occupiers’ housing costs (OOH), along with Council Tax. Both are significant expenses for many households and are not included in the CPI.
Consumer Prices Index
The CPI is a measure of consumer price inflation produced to international standards and is based on European regulations for the Harmonised Index of Consumer Prices. The CPI is the inflation measure used in the government’s target for inflation.
The CPI is produced at the same level of detail as the CPIH in our accompanying dataset and accompanying data time series.
Retail Prices Index
The Retail Prices Index (RPI) does not meet the required standard for designation as a National Statistic. In recognition that it continues to be widely used in contracts, we continue to publish the RPI, its subcomponents and RPI excluding mortgage interest payments (RPIX). To view the all-items RPI, please see the data time series section of our inflation and price indices web page. The annual RPI inflation rate was 8.9% in September 2023.
The UK Statistics Authority and HM Treasury launched a consultation in 2020 on the authority’s proposal to address the shortcomings of the RPI. From 2030 (at the earliest), as outlined in the UK Statistics Authority response to the consultation, the CPIH methods and data sources will be introduced into the RPI. Additionally, the supplementary and lower-level indices of the RPI will be discontinued.
8.Measuring the data
Households and the cost of living
To assist individuals in understanding how the rise in inflation affects their expenditure, we have produced a personal inflation calculator. The calculator allows users to enter the amount they spend across either a reduced or a wide range of categories, to produce an estimate of their personal inflation based on those spending patterns.
Our shopping prices comparison tool shows how the average prices of items have changed over time. As a result, the number of average price series in Table 55 in our Consumer price inflation dataset has been reduced to two, covering petrol and diesel, and Table 54 has been discontinued. The average price data originally presented in these tables are currently still available as time series on our website and can be found using the four-character identifiers in Table 55.
Update on the Household Costs Indices and CPIH-consistent subgroups, UK**
In our statement in June 2022, we set out our ambitions to move our annual experimental estimates of Household Costs Indices (HCIs) onto a regular quarterly publication basis in 2023. The HCIs reflect how different types of households experience changing prices, and differ from the Consumer Prices Index including owner occupiers’ housing costs (CPIH) and the Consumer Prices Index (CPI), which are based on recognised economic principles.
Moving the HCIs to a quarterly publication will better support users’ understanding of how rising prices and the cost of living affect different types of households. It also recognises the HCIs’ unique role in our range of consumer price inflation measures.
In order to meet our objective of beginning our quarterly HCIs publication in 2023, we have temporarily suspended our publication of CPIH-consistent subgroup data, which show the CPIH and CPI rates of inflation for different household subgroups. However, we recognise that there is a current user need for these measures and, while the CPIH-consistent subgroup publication is suspended, we will publish provisional estimates for selected sub-groups based on the previous year’s weights (updated for changes in total UK spending).
The provisional estimates for January to June 2023 are available in Provisional CPIH and CPI-consistent inflation rate estimates for UK household groups: January to June 2023.
We are committed to an ongoing quarterly publication of the HCIs. However, in light of wider prioritisation, we will be focusing our ongoing efforts on transforming and improving our entire range of consumer price inflation measures, including the HCIs, such as through alternative data sources. Our Consumer prices development plan: updated July 2023 describes our wider research plans and lists our priorities.
We will update our publication plans in due course and will continue to discuss these matters with our Advisory Panels on Consumer Prices (APCPs) and other stakeholders.
Weights for 2023 consumer price inflation statistics
In line with usual practice at the start of each year, the expenditure weights used in compiling the CPIH and the CPI were calculated using updated spending information. Normally, this would be national accounts household final consumption expenditure (HHFCE) data lagged by two years. However, because of the unprecedented events of the last few years and the larger changes seen in spending patterns, we adjusted the data so that the resulting weights were more reflective of the year immediately before use in consumer price inflation.
This is in line with the procedures adopted in 2021 and 2022. For more information, see our Consumer price inflation, updating weights articles.
Alternative data sources
We are undertaking a programme of transformation across our price statistics, including identifying new sources, improving methods, and developing systems. For more information about the project and our ongoing transformation plans, see our updated Transformation of consumer price statistics article, released on 6 July 2023.
As usual, we welcome your feedback on our work by email to cpi@ons.gov.uk.
Consumer price inflation historical estimates, UK, 1950 to 1988
On 18 May 2022, we published our Consumer price inflation, historical estimates, UK, 1950 to 1988 –methodology and Consumer price inflation, historical estimates and recent trends, UK: 1950 to 2022 article. These include new estimates of CPIH and improved estimates of CPI for the period 1950 to 1988. These estimates (published in response to user need for a longer series) are indicative and are for analytical purposes only. They are not intended for official use and do not constitute part of the National Statistic series.
Previously, in December 2018, we published our Consumer Prices Index including owner occupiers’ housing costs (CPIH) historical series: 1988 to 2004 article. This series is an official statistic rather than a National Statistic, reflecting the historical uncertainty around the back casts.
Methodology information
The consumer price indices are normally based on prices collected from outlets around the country, supplemented by information collected centrally over the internet and by phone. The figures in this publication use data collected on or around 19 September 2023.
Our Consumer price indices, a brief guide gives an overview of consumer price statistics, while our Consumer Prices Indices Technical Manual covers the concepts and methodologies underpinning the indices in more detail.
Our CPIH Compendium provides a comprehensive source of information on the CPIH, focusing on the approach to measuring owner occupiers’ housing costs.
Our Users and uses of consumer price inflation statistics: July 2018 update includes information on the users and uses of these statistics, and the characteristics of the different measures of inflation in relation to potential use.
9.Strengths and limitations
We have illustrated our future approach to measuring changing prices and costs for consumers and households using three “use cases”, along with how they relate to the measures currently published and those under development. We have also published proposed updates in our Measuring changing prices and costs for consumers and households, proposed updates: March 2020 article.
The three cases refer firstly to the Consumer Prices Index including owner occupiers’ housing costs (CPIH) as our lead measure of inflation based on economic principles. They also refer to the Household Costs Indices (HCIs) as a set of measures to reflect the change in costs as experienced by different households, and the Retail Prices Index (RPI) as a legacy measure that is required to meet existing user needs. Our Shortcomings of the RPI as a measure of inflation article describes the issues with the RPI.
Source: Ons.gov.uk
Original News: Click HERE


